Lesson Plan (Grades K-2): Dino Dig Data Lab - Measuring, Sorting, and Graphing Fossil Finds
Turn a dinosaur dig into a fun K-2 math and science lesson where students sort, measure, graph fossils, and spot patterns like young paleontologists.

Focus: Turn an exciting dinosaur dig into a playful but standards-based math and science lesson in which students excavate “fossils,” sort them by attributes, measure them with nonstandard units, and create simple graphs to describe patterns in what they found.
Grade Level: K-2
Subject Area: Math • Science • Inquiry/Skills
Total Unit Duration: 1 core lesson with 2 optional extension lessons
I. Introduction
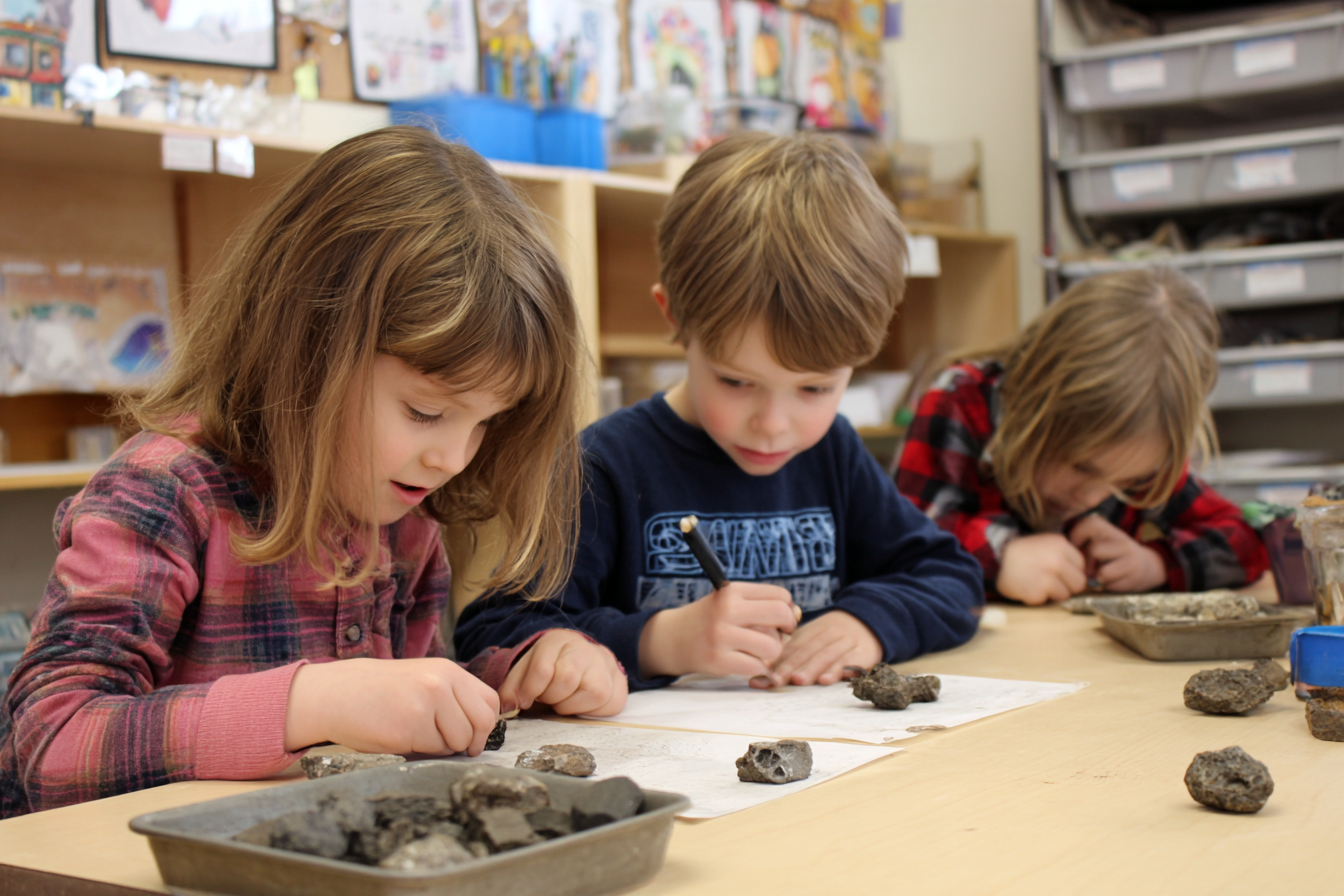
Students become junior paleontologists in a hands-on Dino Dig Data Lab that blends early measurement, sorting, counting, and graphing with scientific observation. In the main lesson, students excavate teacher-prepared “fossils” from sensory bins, trays, paper digs, or sand boxes, then sort their finds by one clear attribute such as type, size, shape, or color. After sorting, students use nonstandard units such as linking cubes or paper clips to measure fossils and then organize class data into a simple graph or category chart. The dinosaur theme makes the lesson highly engaging for K-2 students, while the structure keeps it academically strong and easy for teachers to implement.
Essential Questions
- How can we sort fossils into groups using what we notice?
- How can we measure fossils in a fair and careful way?
- How can a graph help us show what we found?
- What patterns do we notice in our fossil data?
- How do scientists and mathematicians use observations and data to learn about the world?
II. Objectives and Standards
Learning Objectives — Students will be able to:
- Observe and describe fossil finds using visible attributes such as shape, type, size, or color.
- Sort fossils into categories based on one clear attribute and count how many are in each group.
- Measure fossils using nonstandard units such as linking cubes, paper clips, or tiles.
- Organize class or group data into a simple picture graph, bar-style graph, or category chart.
- Use words, drawings, or discussion to describe patterns in the data.
- Explain how their fossil evidence helped them act like both a scientist and a mathematician.
Standards Alignment
- Common Core Mathematics
- CCSS.MATH.CONTENT.K.MD.B.3 — Classify objects into given categories; count the numbers of objects in each category and sort the categories by count.
- CCSS.MATH.CONTENT.1.MD.C.4 — Organize, represent, and interpret data with up to three categories; ask and answer questions about the total number of data points, how many are in each category, and how many more or fewer are in one category than in another.
- Next Generation Science Standards
- K-ESS2-1 — Use and share observations of local weather conditions to describe patterns over time.
- This lesson most strongly supports the practice side of NGSS by helping students make observations, organize evidence, and describe patterns using real collected data.
Success Criteria — Student Language
- I can sort fossils into groups by what I notice about them.
- I can count how many fossils are in each group.
- I can measure a fossil using cubes or another small unit.
- I can help make a graph that shows our fossil data.
- I can talk about a pattern I see in our results.